Products
GenieATM Series
Solutions
AI-Enabled Network Security
Advanced intelligence for evolving threat protection
Data Correlation for Forensic Insights
Empower network lawful interception and performance optimization
Insight-driven Optimization
Actionable insights for maximized network performance
DDoS Protection
Real-time detection and mitigation against DDoS and Botnet threats
Managed Service Enabling
Unlock new revenue streams with existing network capabilities
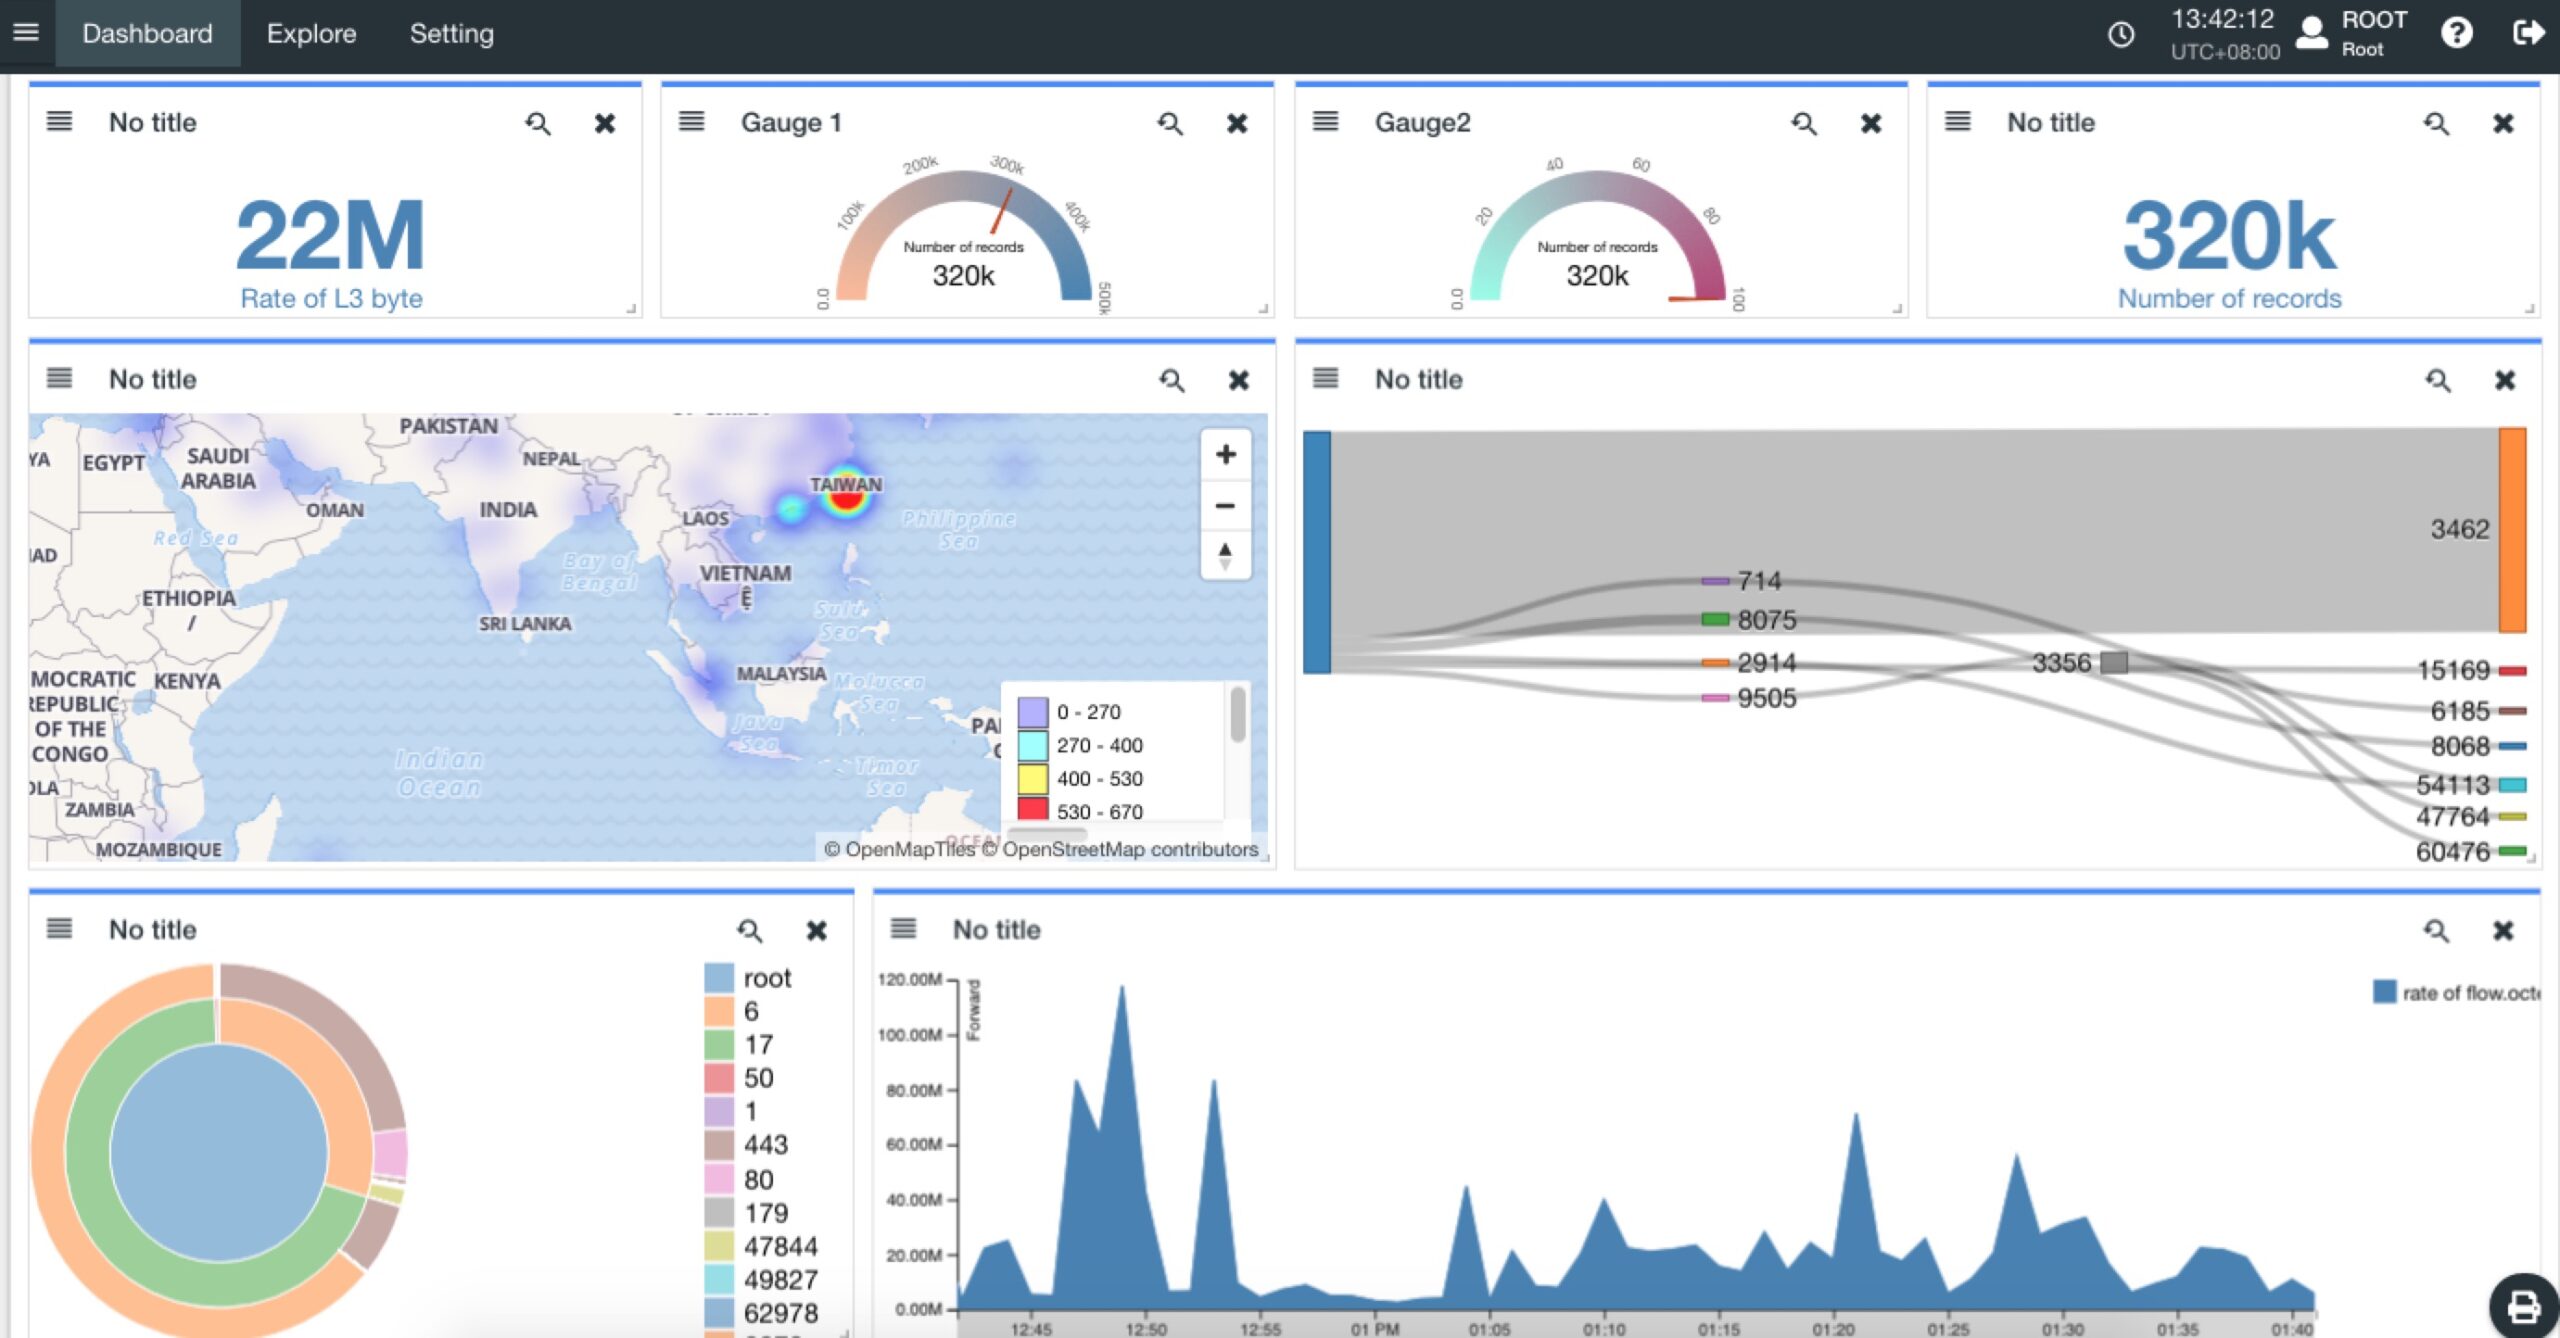
Enriched Traffic Data Exploration
Agile, ad-hoc analytics on enriched big traffic data
Insights